Competitive Analysis Template for B2B (Free, With a Worked Example)
A free, ungated B2B competitive analysis template with the section most templates skip: how buyers actually perceive each competitor.


Updated November 4, 2026
Most competitive analysis templates are feature grids. Rows of features, columns of competitors, green checkmarks and red Xs. They tell you what your competitors sell. They don't tell you why buyers pick them.
That's the part that matters. A few years ago I asked 30+ people which sales intelligence tool they'd choose. Many said Gong: "it's the best," "top brand," "the category leader." Others picked Avoma: "it's basically the same thing, why pay more." Same products, different stories.
My takeaway then, and now: objective truths don't matter much. What matters is what buyers believe.
This template has the usual sections, plus the one most templates skip: how buyers actually perceive each competitor. It's free and ungated.
Download the free template (.xlsx): the analysis grid, a messaging teardown, a qualifiers vs determiners sorter, a relative value table, and a response plan that flags overdue reviews.
A competitive analysis is a structured comparison of the alternatives your buyers consider, covering what each offers, how they go to market, what they say, and how buyers perceive them, so you can decide where to compete and how to position. In B2B, the goal isn't to know everything about competitors. It's to know why you win and lose against each one.
Three problems show up again and again.
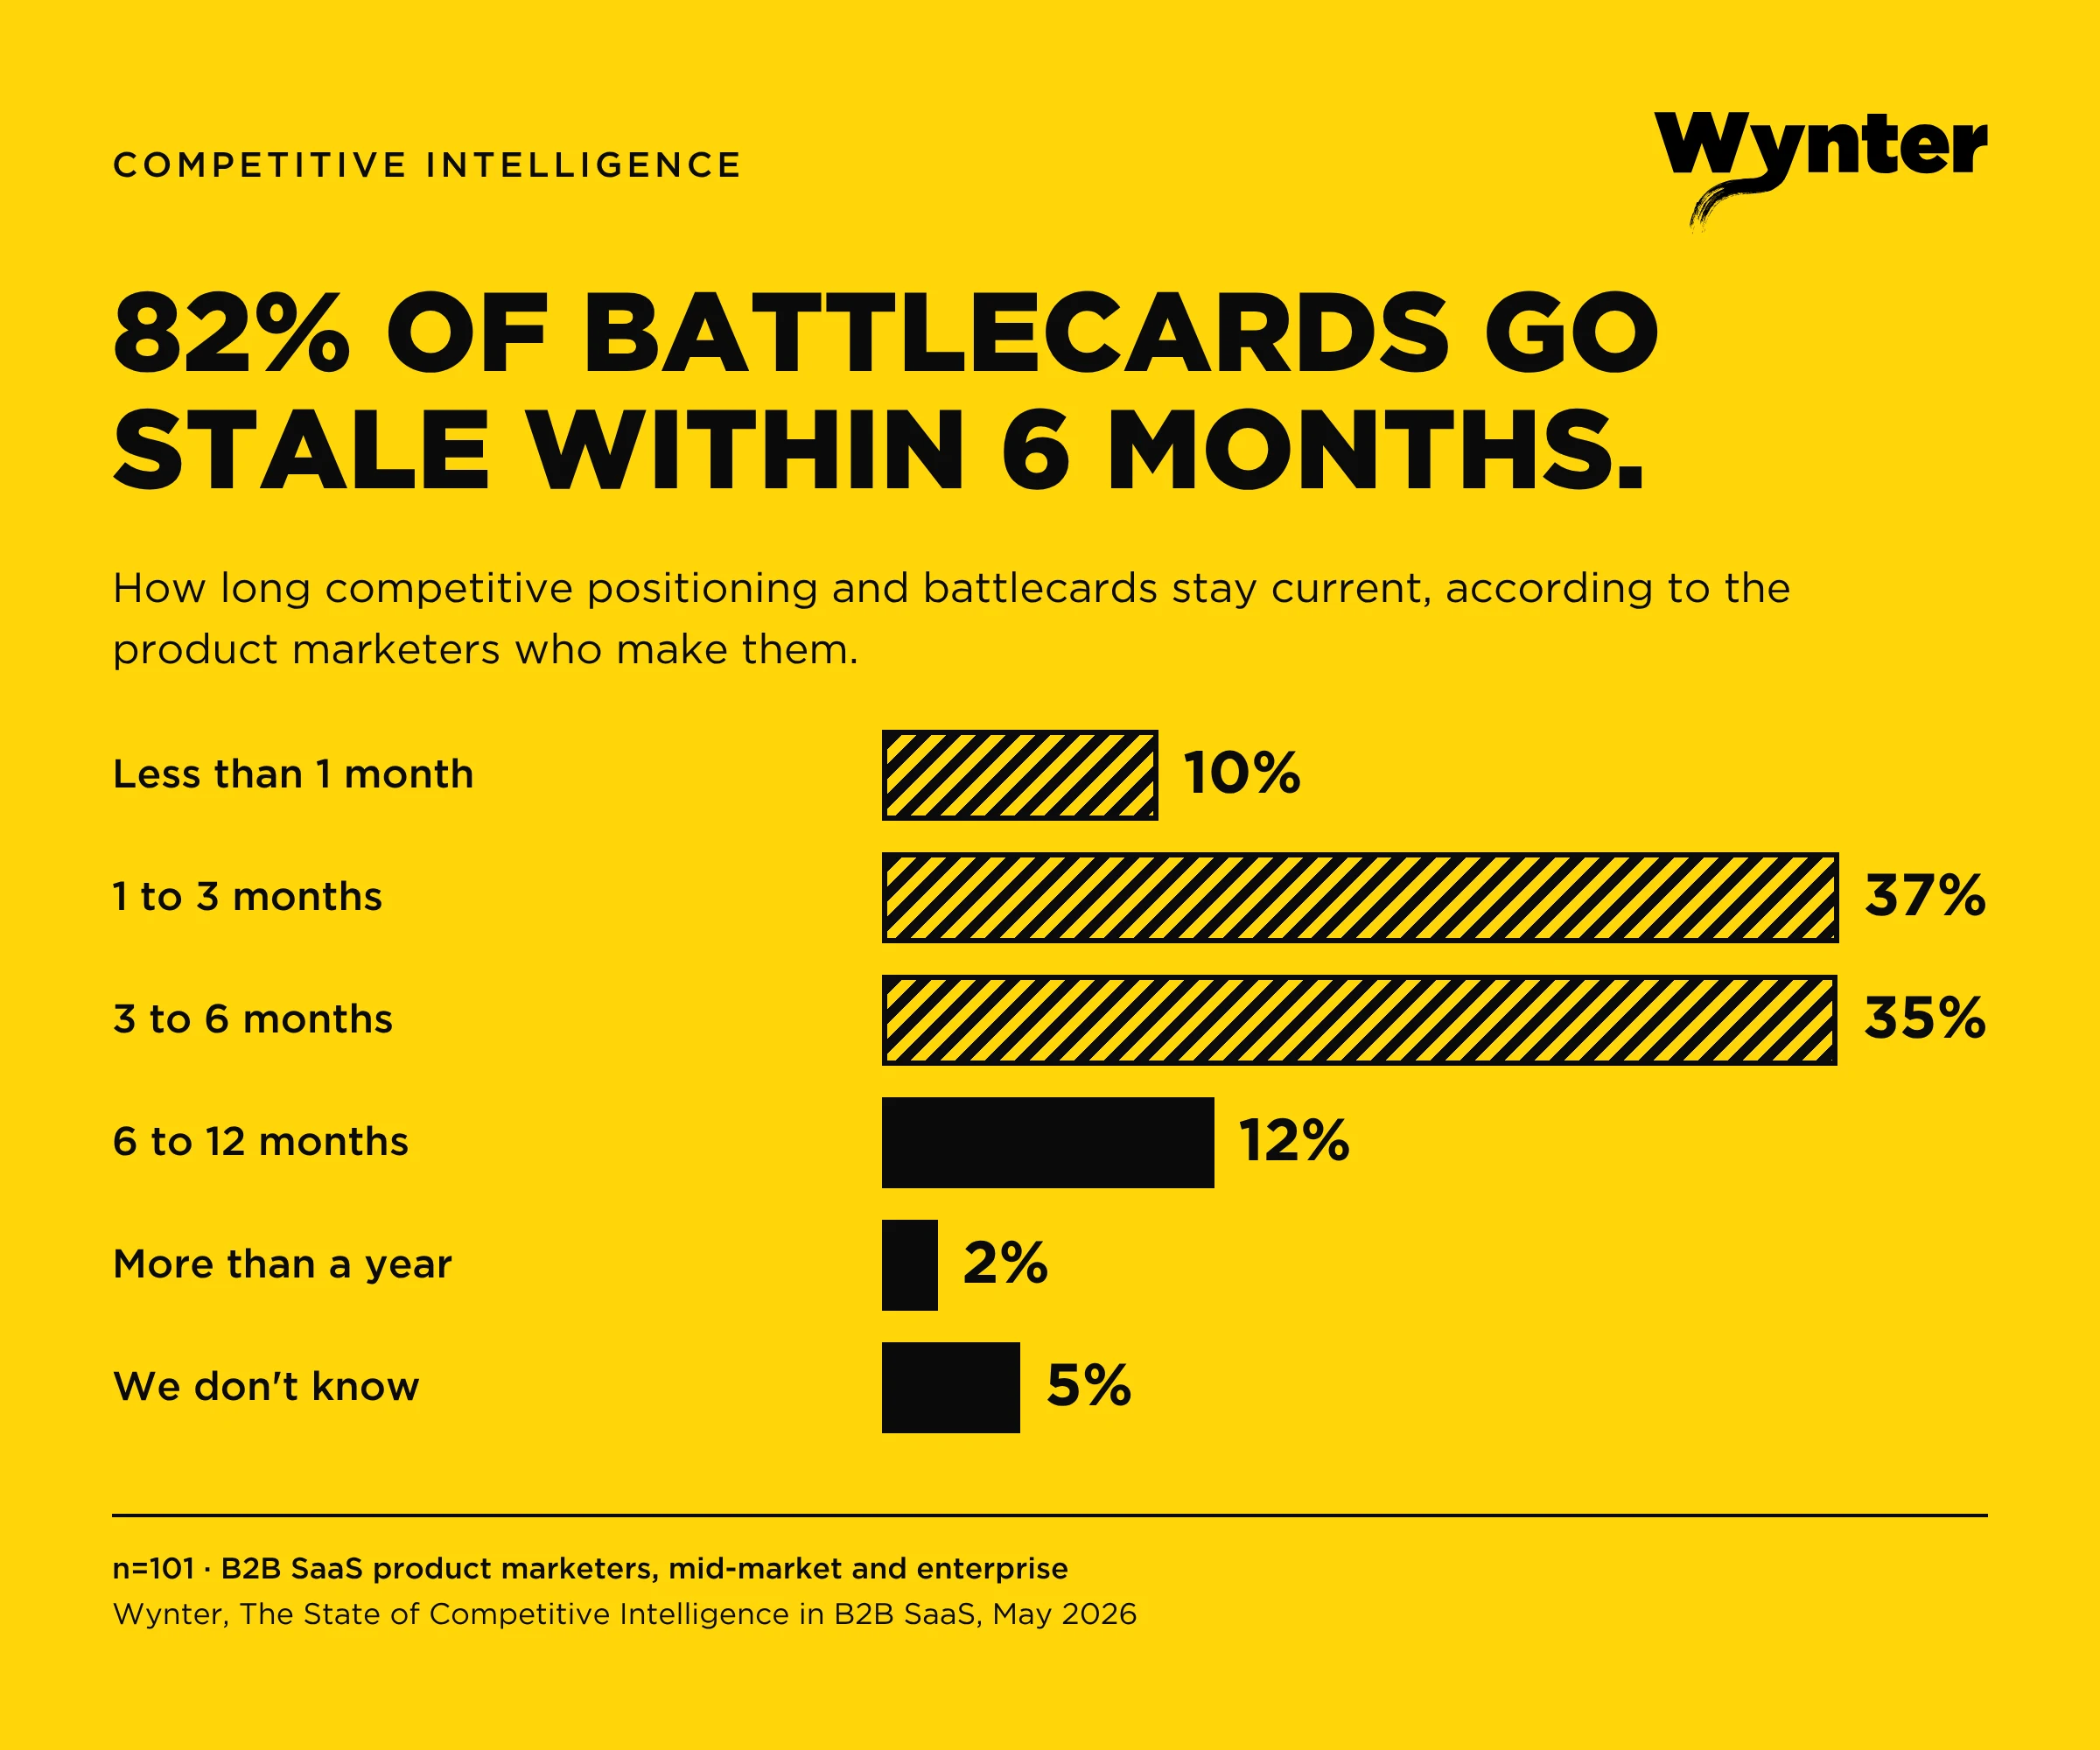
It goes stale fast, and nobody uses it. In Wynter's State of Competitive Intelligence in B2B SaaS (May 2026, n=101 product marketers), 47% said their battlecards go stale within 3 months, and 82% within 6. As I put it then: "Your competitor ships a feature on Tuesday. Your battlecard is wrong on Wednesday. Sales finds out on Friday from a customer."
37% said their sales team mostly freestyles or ignores CI content. One PMM: "All our battlecards are buried in Seismic, which is NEVER on-screen when a seller most needs them." Another: "They use a lot of Claude or Gemini when competitors come up on a call." And only 21% of companies have someone whose actual job is competitive intelligence. In 52%, product marketing owns it on top of everything else.
It lists the wrong competitors. Companies list the logos they see in deals and forget the real alternatives. As I wrote in 2021: "Categories and market segments don't actually exist, it's a mental construct." I could use Asana or I could use Coda. On paper, different categories. In practice, alternatives. April Dunford makes the same point in Obviously Awesome (2019): your real competition is whatever the buyer would do if you didn't exist, including spreadsheets, an agency, an intern, or doing nothing.
It's built from your point of view, not the buyer's. A feature grid shows what you think matters. Buyers decide on a much shorter list. And they can't tell vendors apart as well as you think. In Wynter's B2B Vendor Differentiation Survey, buyers shown 5 value propositions matched them to the right vendor 1.86 times out of 5. Random guessing gets you 1.
Six sections, one column per competitor. Add a column for your own company and fill it in as honestly as the others.
| Section | Fields | Where to find it |
|---|---|---|
| 1. Snapshot | Founded, size, funding, revenue estimate, target segment, category they claim | LinkedIn, Crunchbase, their about page |
| 2. Product and pricing | Core use cases, key features, packaging, list price, free tier or trial | Their site, pricing page, G2, docs |
| 3. Go-to-market | Sales motion (PLG, sales-led), main channels, partners, events, ad activity | LinkedIn Ad Library, Google ads, events lists |
| 4. Messaging | Homepage headline, main claim, proof points, tone, who they say it's for | Their homepage and top landing pages |
| 5. Buyer perception | What buyers associate them with, why buyers pick them, why buyers rule them out, awareness and preference scores | ICP survey, win-loss, message and preference tests |
| 6. Response plan | Where we win, where we lose, our counter-message, proof we need, owner, next review date | Your team, from sections 1 to 5 |
Also add a row for "what does ChatGPT say about them?" Ask an LLM to compare you and each competitor for your main use case. Buyers are already doing it.
Step 1. List the real alternatives. Pull your last 20 deals, won and lost. Who else was in the running? Add "do nothing" and any manual workaround. If a category leader exists, it's on the list even if you never see it in deals. As I wrote in 2024: "If there's a category leader or other well-known brands in your category, it's a safe bet they're comparing you to them."
Step 2. Fill sections 1 to 3 from public sources. This is desk research. Timebox it to an hour per competitor. Don't let this part eat the whole project. It's the least useful part.
Where do product marketers actually get competitive intel? In the same CI study: 44% from sales call recordings, 34% press and news, 28% competitor websites and changelogs, 27% G2 and review sites, 23% Reddit, 21% LLMs, and only 14% from dedicated CI tools. Some of the best sources came from the open answers: "Your churned customers. The most underused source by far. They'll tell you exactly why they left." "New hires from competitors in their first 30 to 90 days." "Conference talks and webinars. People overshare on stage in ways their marketing team would never approve."
Step 3. Capture their messaging (section 4) word for word. Screenshot the homepage. Copy the headline, subhead and the first 3 claims. Then run the logo swap test: put your logo on their homepage. Does it still make sense? If yes, neither of you is saying anything distinct. For a deeper, messaging-only version of this step, see our guide to competitive messaging analysis.
This is the norm, not the exception. In Wynter's Sameness Benchmark of 445 B2B SaaS websites, the average Sameness Index was 56.6, only 12.1% of messaging was unique, and 99.1% of sites claimed AI. Email marketing is the worst: 72% of the messaging on the average email marketing tool's homepage also appears on competitors' sites. You can check your own homepage against up to 4 competitors with the free Sameness Checker.
Buyers notice. When we asked 100 marketing leaders how often they think "these all basically do the same thing" while comparing vendors, 98% said at least sometimes, and 61% said often or constantly. Only 2% rarely or never feel it.
Nobody sets out to sound generic. As I wrote in 2026: "It happens one approval at a time. The bold line gets flagged as 'too aggressive.' The competitor callout gets cut as 'not on brand.' The sharp claim gets hedged because legal wants it safer. Each edit is reasonable. The sum is a homepage that could belong to any of your competitors."
Step 4. Separate qualifiers from determiners. In 1968, James Myers and Mark Alpert showed that the attributes buyers say are important aren't always the ones that decide between options (Journal of Marketing, 32(4)). Security, reliability and support are qualifiers: you need them to be considered, but everyone has them, so they don't decide anything. Determiners are the few attributes where vendors actually differ and buyers care.
Leading with a qualifier is the most common competitive messaging mistake I see. "Secure, reliable, easy to use" doesn't win the shortlist. It gets you to the starting line.
Step 5. Get buyer perception from buyers (section 5). This is the section only research can fill. Three ways:
Use 50 to 100 respondents for the survey, 30 to 50 for a preference test.
Step 6. Write the response plan (section 6). For each competitor: one sentence on where you win, one on where you lose, and the counter-message you'll use. Assign an owner and a review date.
Here's section 5 filled in for 2 brands, using Wynter's syndicated ABM platform study (n=100 B2B marketers):
| Field | 6sense | Demandbase |
|---|---|---|
| Familiar (somewhat or very) | 94% | 84% |
| Would consider | 68% | 56% |
| Top preference | 48% | 25% |
| Seen as most distinct | 58% | 15% |
| Top attribute | Intent data quality (77%) | Intent data quality (60%) |
| Second attribute | Integrations (54%) | Integrations (42%) |
| Weakest attribute | Value for money (6%) | Value for money (10%) |
If you're Demandbase, this changes the response plan. Your strongest perceived attribute is the same as the leader's, and the leader owns it more. Competing on intent data means fighting on 6sense's ground. Meanwhile, no brand in the category owns value for money or ease of setup. That's where a counter-position could go, if the product can back it up.
You can't get this from a feature grid. Both companies have intent data features. What differs is what buyers believe.
| Framework | Use it for | Limitation |
|---|---|---|
| SWOT | A quick internal snapshot for a planning meeting | Inside-out, based on your opinions |
| Porter's Five Forces | Judging how attractive a market is (Porter, HBR, January 2008) | Industry-level, says nothing about messaging |
| Perceptual map | Showing where brands sit on 2 dimensions buyers care about | Only as good as the 2 dimensions you pick, and the data behind them |
| Qualifiers vs determiners | Deciding what to lead with in messaging | Needs buyer data to tell the two apart |
| Relative value table | Sales and website comparison pages | Only covers differences, by design |
On that last one. Most comparison pages are long tables listing every feature with green checkmarks and red Xs. Don't do it. When buyers are comparing solutions, they only care about the differences. Show only the features that are actually differentiated, then quantify what the difference is worth.
The point of all this is a decision: where do we compete, and what do we say?
Buyers will compare you either way. In our B2B Buyer Journey research, buyers started with a longer list and narrowed it to 3 vendors to talk to, without talking to sales. The final cut is mostly "how is X different from Y?" In thousands of message tests, it's the #1 question category buyers ask.
When the shortlist feels interchangeable, buyers go looking for the difference themselves. 41% of the marketing leaders we surveyed said their first move is to push for a trial or demo, because the website never spelled it out. One VP told us why she picked one tool over two rivals: "their AI use cases were clearly stronger. Drift felt legacy with 'AI' bolted on, and Chili Piper's use cases were super broad." That's the level of differentiation buyers want: named, compared, concrete.
So:
There's research behind this. Behavioral experiments show that when similar options compete, they all become less attractive, while an option that stands apart becomes more attractive, even when the difference isn't particularly meaningful. Sameness is a losing strategy, albeit it's the most common one.
Once you've picked the angle, concept test it with buyers before you rewrite the homepage.
Given that 82% of PMMs say battlecards go stale within 6 months, put the review date in the template and in someone's calendar.
Quarterly may not be fast enough anymore. Competitors now ship new positioning, a new agent or a new category every few weeks. You don't need a five-figure CI tool to keep up. I built a competitive intelligence monitoring agent in n8n in a couple of hours. It scans news, websites and announcements daily for positioning shifts, pricing changes and feature releases, and pipes a digest into Slack. Then use the template for what an agent can't do: deciding what it means and what you'll say back.
What is a competitive analysis template? A competitive analysis template is a structured document, usually a spreadsheet, for comparing the alternatives your buyers consider: their product, pricing, go-to-market, messaging and how buyers perceive them.
What should a B2B competitive analysis include? A snapshot of each competitor, product and pricing, go-to-market, messaging, buyer perception and a response plan. Include indirect alternatives like spreadsheets and doing nothing, not just direct competitors.
How do you do a competitive analysis? List the real alternatives from recent deals, fill in public information, capture each competitor's messaging word for word, separate qualifiers from determiners, get buyer perception through surveys or tests, then write a response plan for each competitor.
What is the best competitive analysis framework? It depends on the decision. Porter's Five Forces for market attractiveness, SWOT for internal planning, perceptual maps and qualifiers vs determiners for positioning and messaging.
How often should you update a competitive analysis? Messaging quarterly, buyer perception once or twice a year, and everything else when a competitor makes a significant move.
Brand perception survey · Concept testing in B2B · Voice of the customer for B2B · B2B buyer personas · Copy testing


